My excellent researchers Wenyan Deng, Winston Berg, and Cathryn Grothe have done great work tracking down disaggregated electoral turnout/vote shares, Sri Lankan Police and Army fatalities, and a map of polling divisions in Sri Lanka.
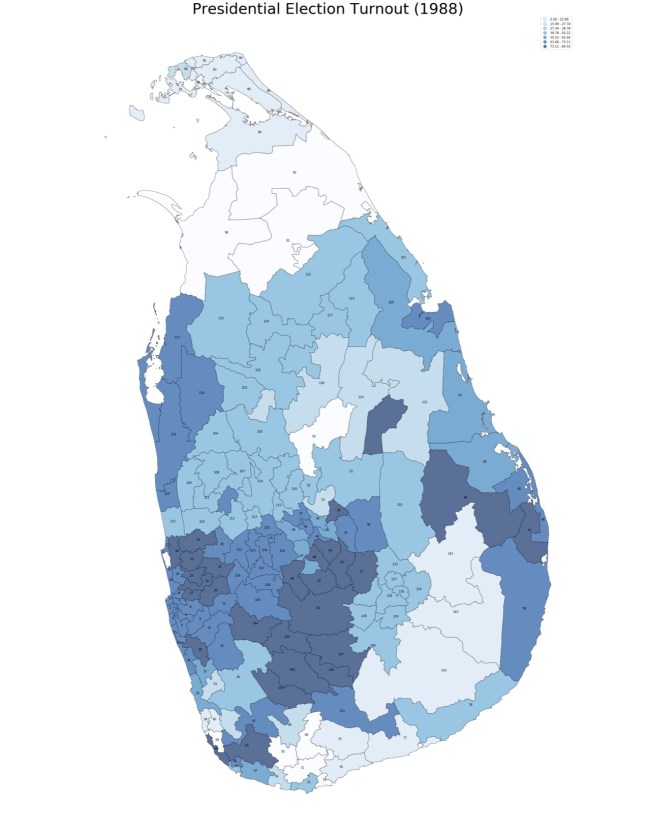
As a first-cut of what will come, here’s a map by polling division (the smallest unit we have data on) of electoral turnout in the 1988 election; the darker the color, the higher the turnout. What I’m interested in: those deep South and some Central divisions with very low turnout. Why? In our SLA fatalities data, they also show very very few SLA deaths over the whole course of 1988 (we’ll see what the Police data show – may be different). By contrast, the north continues to be a place where the SLA (and, vastly more so, the IPKF) are mixed up with the LTTE, so turnout and fatalities align more closely.
The JVP in 1988 was not yet targeting the Army, so looking at security force fatalities (with Police caveat!) proves to be a highly unreliable guide to areas of JVP influence in this period. But since the JVP wanted a boycott, turnout becomes a more useful proxy. The right indicator to use for measuring armed group presence/influence/control is likely to be highly contextual – sometimes it will be violent events, but sometimes it won’t.